
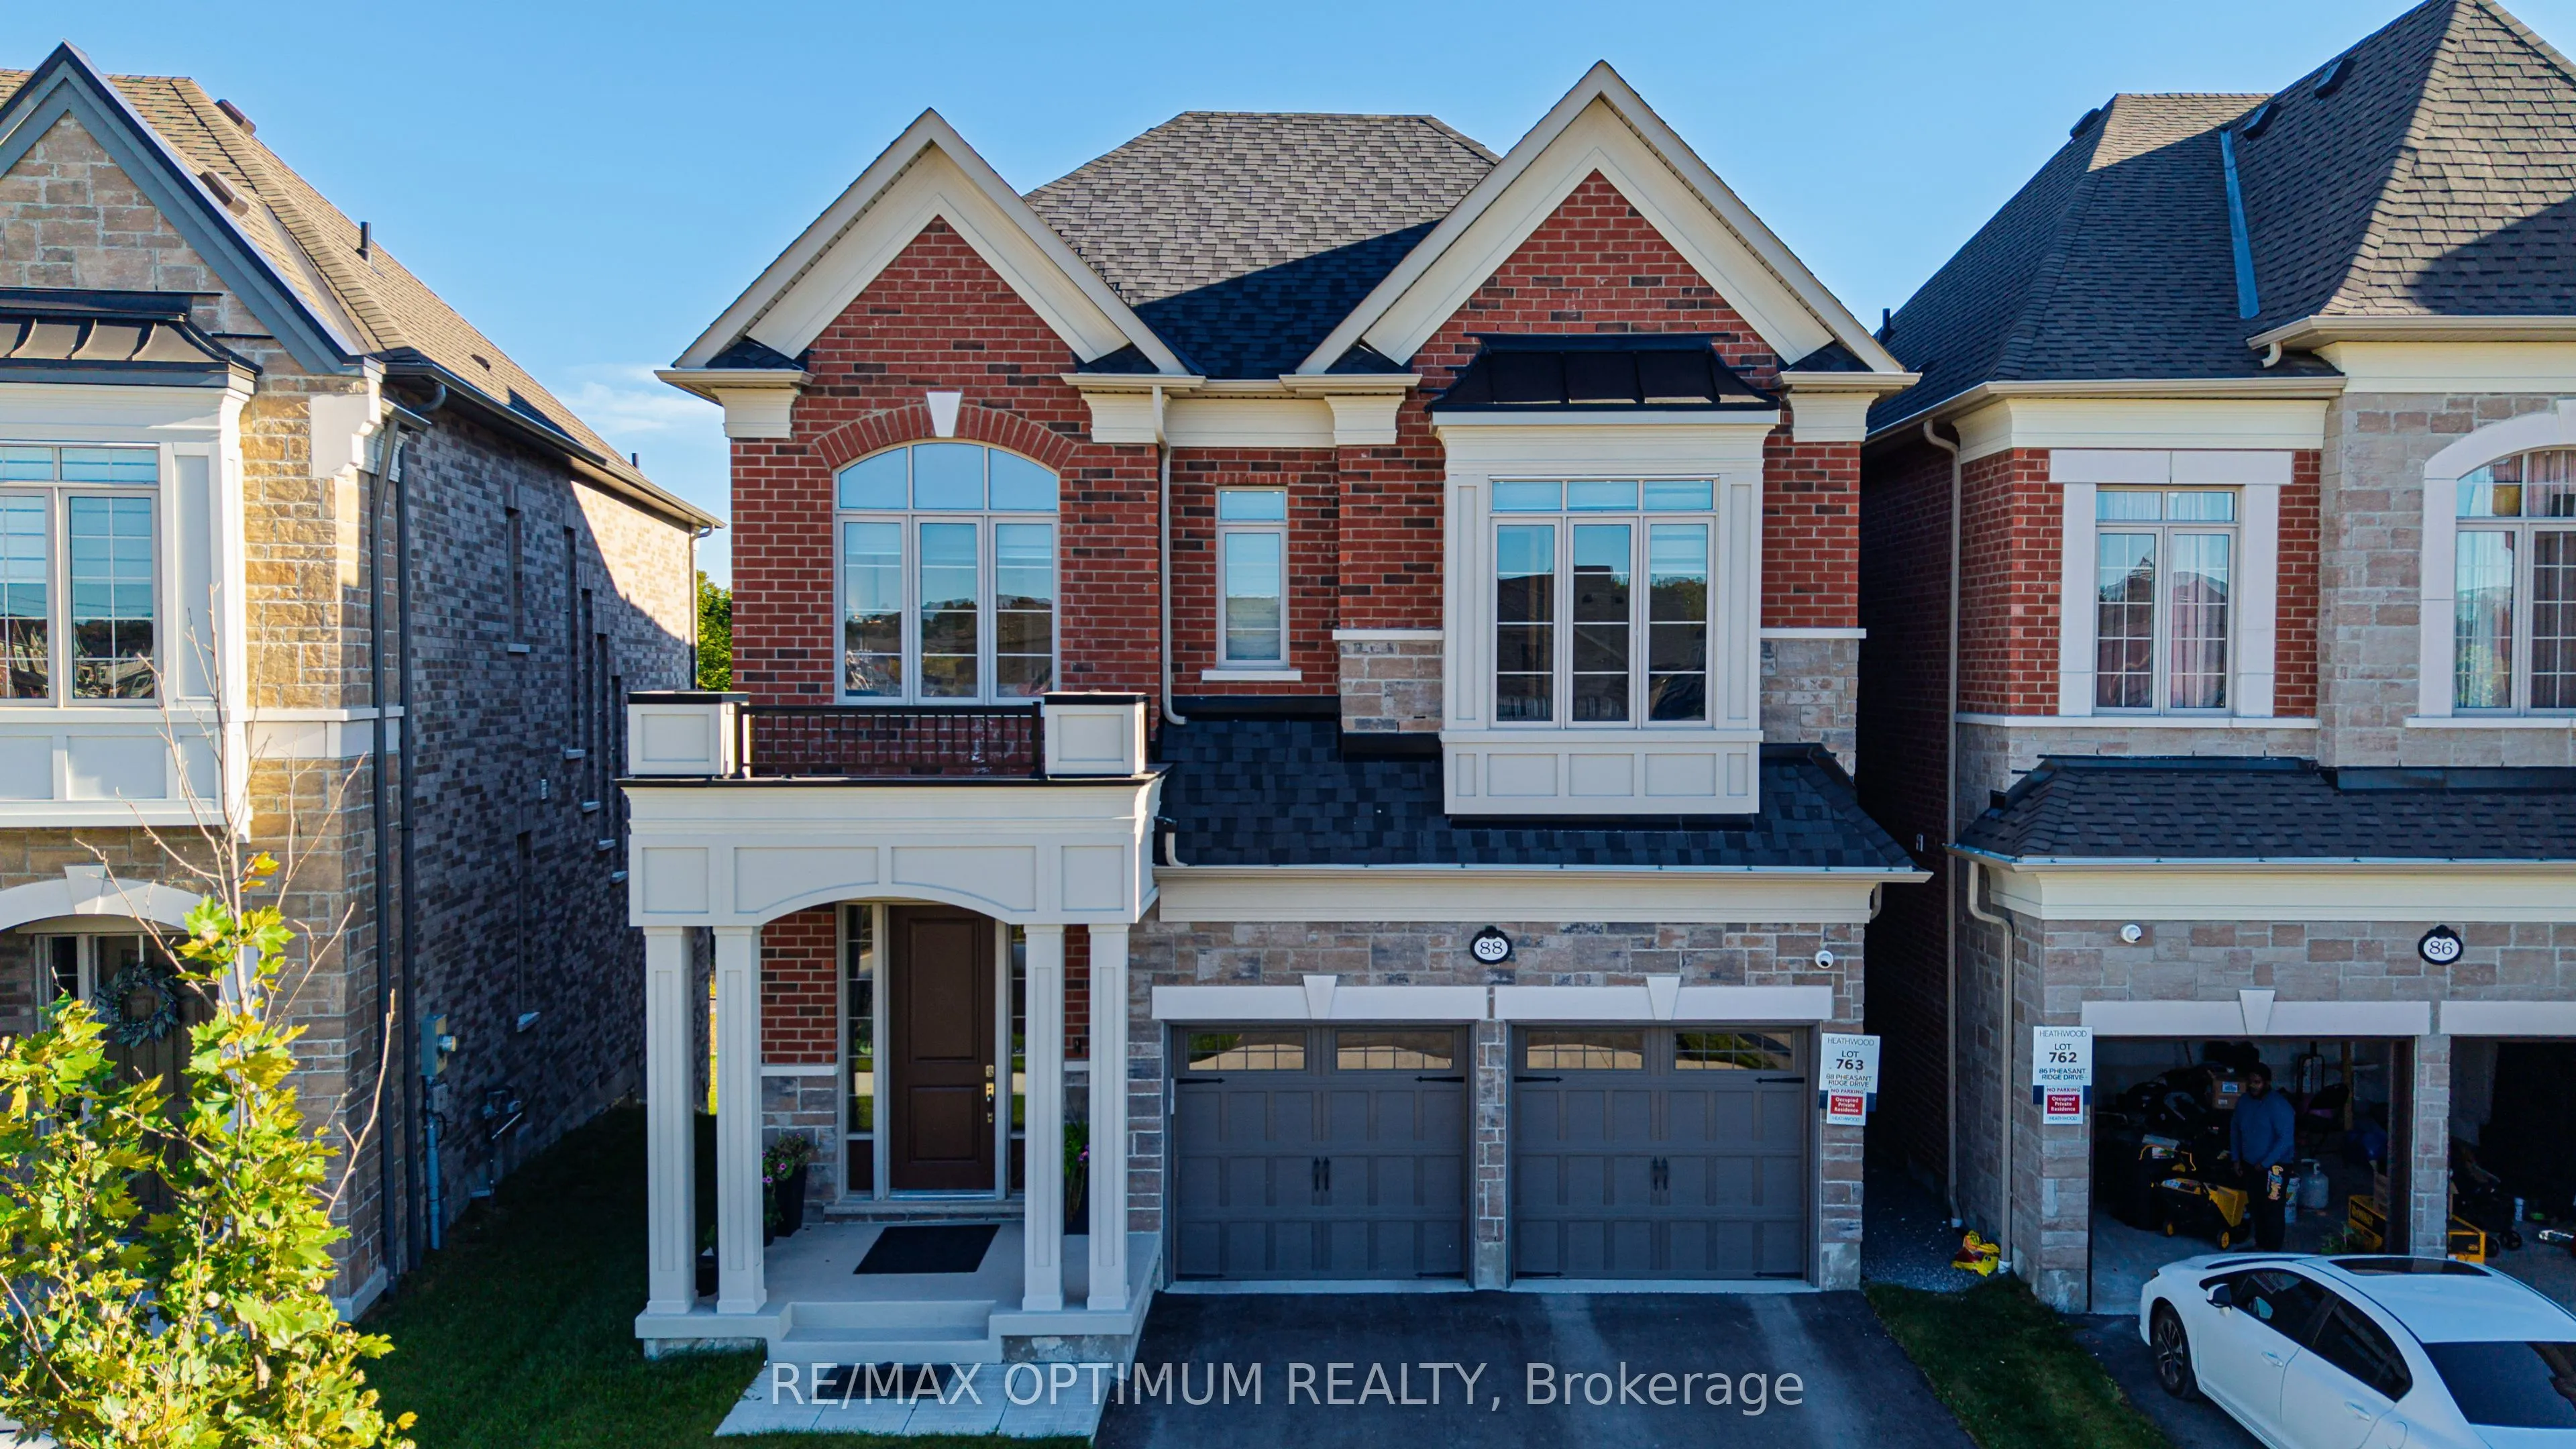
 FOR SALE
88 Pheasant Ridge Drive
$1,474,000
Whitby, ON
4+1 beds5 bathsDetached
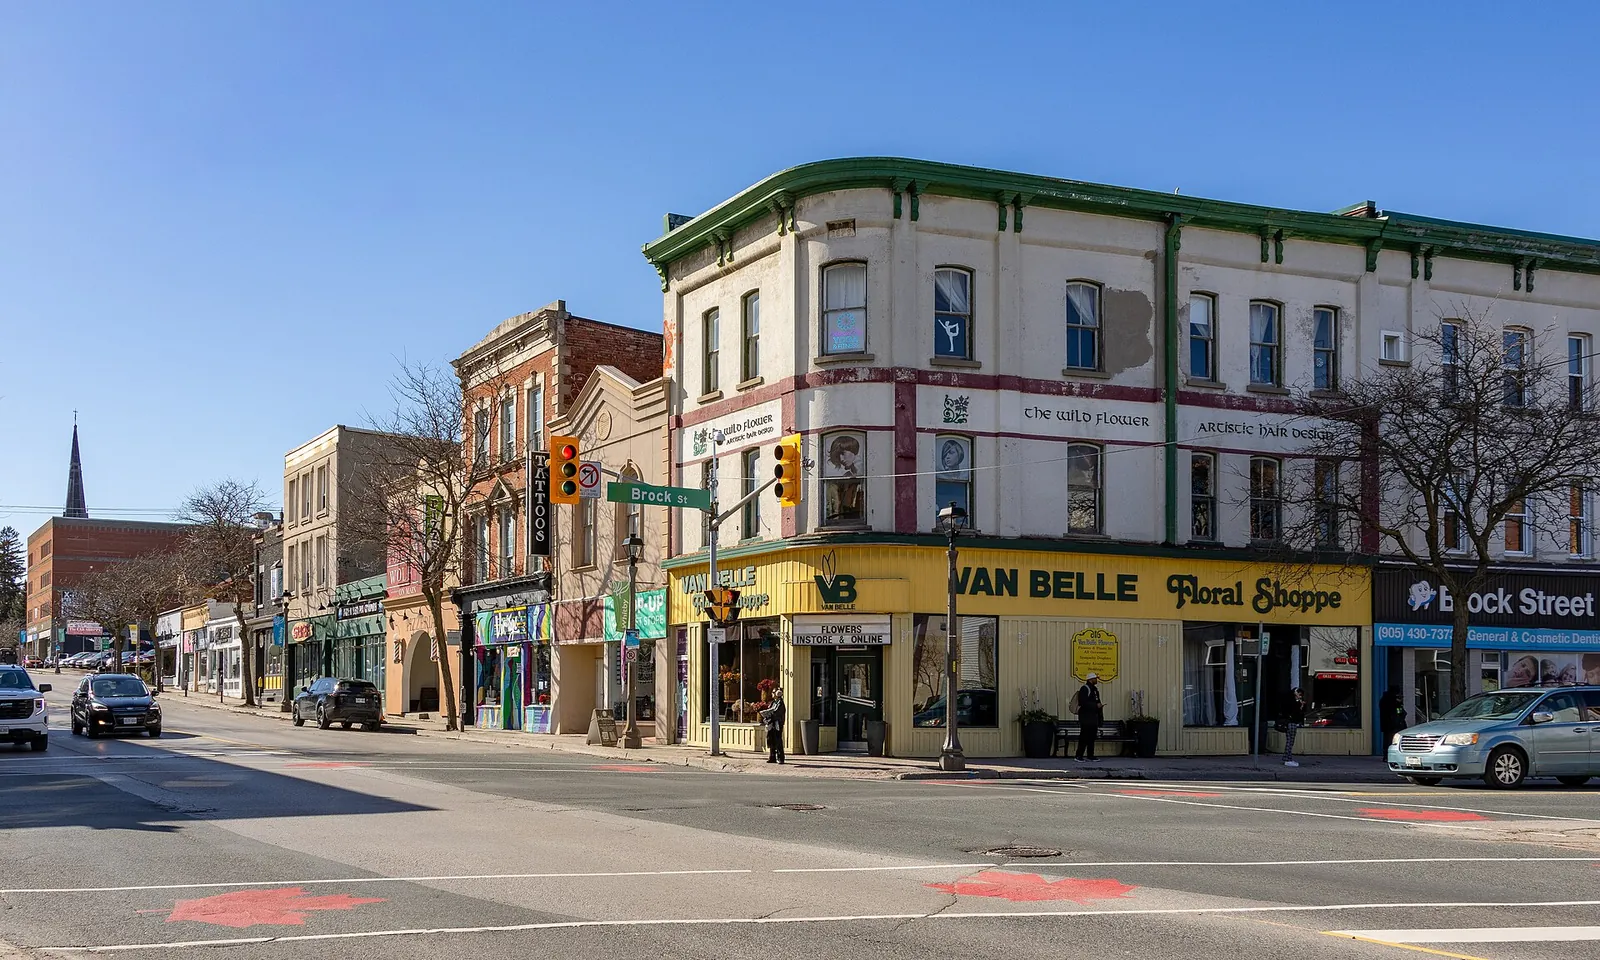
PORT WHITBY, ONTARIO
Get to know Port Whitby in Whitby. Compare local market history, explore featured homes across Whitby, and tell us what you are looking for.
Your next chapter starts with
a little local knowledge.
MAKE YOUR NEXT MOVE
City-wide listings for Whitby.
These homes are not filtered to Port Whitby.
No featured homes match these filters. Try a different price or home type, or ask us to help you find more options.
Featured Team Arora listings, not the complete Whitby MLS® inventory. Prices and availability may change. Confirm all property details with our team.
A LOCAL MARKET SNAPSHOT · SEP 2026
Historical data for the source’s Port Whitby reporting area.
Snapshot collected November 15, 2026.
The available monthly counts from Oct 2025 through Sep 2026 total 122 recorded sales for the Port Whitby source area. The highest monthly sales count in this period was 17 in Jun 2026. In the latest month, 29 properties were newly listed for sale and 38 were recorded as active.
Condo apartments had the largest recorded sales count among the property categories shown below, with 5 sales in Sep 2026. Compare the individual categories before using an area-wide median to plan your search.
Swipe the table on smaller screens. Price medians are withheld when fewer than five sales were recorded.
| Month | Median sold | Sales | Active listings | New listings | Listing days |
|---|---|---|---|---|---|
| Sep 2026 | $710,500 | 8 | 38 | 29 | 32 |
| Aug 2026 | $740,000 | 6 | 31 | 19 | 30 |
| Jul 2026 | $760,000 | 12 | 36 | 22 | 29 |
| Jun 2026 | $771,250 | 17 | 41 | 27 | 24 |
| May 2026 | $780,000 | 11 | 47 | 35 | 22 |
| Apr 2026 | $780,000 | 15 | 35 | 29 | 26 |
| Mar 2026 | $786,250 | 13 | 32 | 31 | 24 |
| Feb 2026 | $765,000 | 12 | 34 | 22 | 26 |
| Jan 2026 | $775,000 | 5 | 32 | 24 | 27 |
| Dec 2025 | $765,000 | 6 | 24 | 9 | 27 |
| Nov 2025 | Limited sample | 4 | 43 | 17 | 26 |
| Oct 2025 | $790,000 | 13 | 46 | 40 | 25 |
| Property type | Median sold | Annual median change | Recorded sales | Active listings |
|---|---|---|---|---|
| Detached homes | Limited sample | — | 1 | 9 |
| Semi-detached homes | Limited sample | — | 1 | 1 |
| Freehold townhomes | Limited sample | — | 1 | 9 |
| Condo townhomes | Limited sample | — | 0 | 0 |
| Condo apartments | $560,000 | -6.7% | 5 | 15 |
| Link homes | Limited sample | — | 0 | 3 |
Source: HomeNCondos · Port Whitby market insights ↗. These historical figures describe the provider’s reporting area; reporting boundaries can differ from municipal or neighbourhood boundaries. Areas can overlap, so their counts and medians should not be added together. Listing days and median-change measures follow the source’s definitions. These are dated market statistics, separate from the current Team Arora featured listings above. A median is not a valuation of an individual home.
EXPLORE YOUR OPTIONS
Open a local market guide.
Featured listings on each guide cover Whitby city-wide.
YOUR NEXT STEP
The featured homes cover all of Whitby. This page uses Port Whitby market data for local context, while the listing search is city-wide. Contact us for a search focused on a particular street, community or home type.
Open a property above or use the contact form below. Include the address or MLS® number, your preferred viewing time and any questions about the home.
The tables are a historical snapshot collected November 15, 2026, with the latest available month shown in the heading. They do not represent live prices. Ask our team for current comparable sales for a specific property.
YOUR PORT WHITBY CHAPTER
Tell us what home looks like to you.
We’ll help you take the next step.
RE/MAX Optimum Realty, Brokerage
Ask about homes, book a viewing or get local guidance.